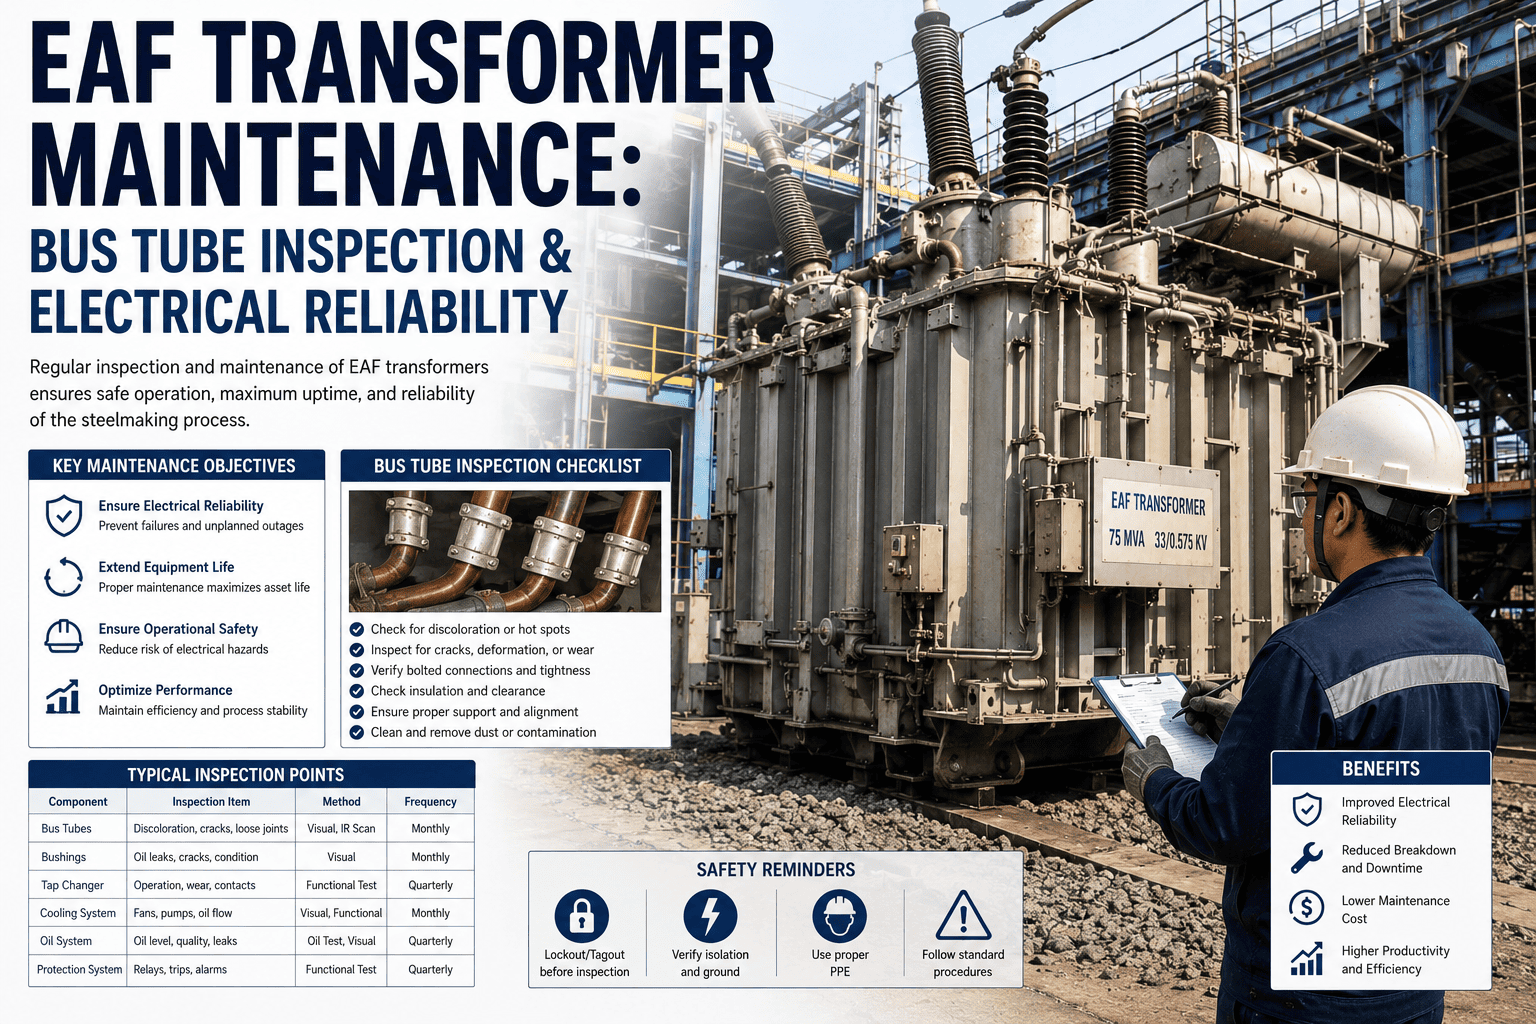
An EAF transformer pushes 30 to 120 MVA through a secondary circuit carrying 45,000 to 80,000 amps, and every bit of that current has to pass through bus tube joints that flex, heat up and cool down thousands of times a season. A joint that loosens by even a few degrees of torque can run hot for weeks before anyone notices, and by the time it's visible it's often too late to save the connection. Sign up for a free trial to see how Oxmaint tracks bus tube and transformer health across your whole EAF electrical circuit.
$5-15M
Replacement cost of an EAF transformer, with a 12 to 24 month lead time if one fails outright
80,000A
Peak secondary current a bus tube joint must carry without a single loose connection
80%
Of electrical failures preventable through flex cable and bus joint condition tracking
190 Hrs
Yearly downtime recoverable through transformer and bus joint monitoring alone
Why Bus Tube Joints Fail Before Anything Else
The electrical secondary circuit runs under constant electromagnetic force and thermal cycling every time the arc strikes and settles. Bus tube joints, flex cables and electrode arm connections absorb that stress directly, and a joint that loosens builds resistance, then heat, then oxidation, in a cycle that feeds on itself. Left unchecked, a single degraded joint can take out the connection entirely and force an unplanned electrical outage in the middle of a melt.
Bus Tube vs Flex Cable vs Tap Changer: Where to Focus Inspection
| Component |
Common Failure Mode |
Recommended Check |
| Bus tube joints |
Torque loss and contact oxidation raising local resistance and heat |
Annual infrared thermography of every bus connection |
| Flex cables |
Strand breakage from repeated electrode arm flexing over the campaign |
Cable life tracking against duty cycles, not just calendar age |
| Tap changer |
Contact wear from frequent voltage regulation switching |
Servicing on manufacturer schedule, not extended past interval |
See Every Bus Joint's Temperature Trend in One Place
Oxmaint logs infrared readings, torque checks and DGA results against each connection so a slow drift shows up long before a joint runs hot. Sign up for a free trial to load your own transformer and bus tube data, or book a demo and we'll walk through your electrical reliability program.
The Electrical Reliability Checklist, In Order of Frequency
W
Weekly cooling checks
Oil level, temperature and flow readings on the transformer cooling system, since cooling failure is what turns a manageable fault into a critical one
Q
Quarterly dissolved gas analysis
Oil sampling that flags arcing, overheating and insulation breakdown months ahead of an actual failure event
A
Annual infrared thermography
Full scan of bus connections and joints to catch resistance building up before a joint runs into thermal runaway
What Dissolved Gas Analysis Actually Tells You
Different gases point to different problems: hydrogen tends to signal partial discharge, acetylene points to arcing, and ethylene points to a thermal fault developing in the oil. Reading these against the transformer's own baseline, rather than a generic threshold, is what turns a lab report into an early warning instead of a number nobody acts on.
Frequently Asked Questions
Q
Why do bus tube joints fail more often than the bus tube itself?
The tube itself is a solid, continuous conductor, but a joint is a mechanical connection held together by torque and contact pressure. Vibration and thermal cycling gradually loosen that pressure, and once contact resistance rises, the joint heats faster than the surrounding tube and the problem accelerates on its own.
Q
Is quarterly dissolved gas analysis really enough to catch a developing fault?
For most steady-state faults, yes, since arcing and overheating build gas concentration gradually across weeks. The key is comparing each result to the transformer's own historical trend rather than reading one sample in isolation, since a sudden jump between two quarters matters more than the absolute number.
Q
What's the real cost of ignoring flex cable wear?
Flex cables carry full secondary current while constantly flexing with the electrode arm, so strand breakage is cumulative and invisible until a cable fails mid-heat. Since these connections sit alongside bus joints as major contributors to electrical failure, tracking duty-cycle wear rather than calendar age catches degradation while replacement can still be planned.
Q
How much downtime can better electrical monitoring actually recover?
Plants combining flex cable tracking, bus joint monitoring and transformer DGA typically prevent the large majority of electrical failures outright, recovering close to 190 hours a year that would otherwise go to unplanned electrical stops. That recovery comes from catching degradation weeks before it becomes an outage, not from working faster once something breaks.
Keep Your EAF Transformer Off the Emergency Reorder List
Oxmaint gives steel plant teams DGA trend tracking, bus joint thermography records, flex cable duty-cycle logs and tap changer service scheduling in one platform. Sign up for a free trial to explore it yourself, or book a demo and we'll walk through it against your own EAF electrical system.
Bus Joint Thermography
DGA Trend Tracking
Flex Cable Duty-Cycle Logs
Tap Changer Scheduling
Fleet-Wide Visibility