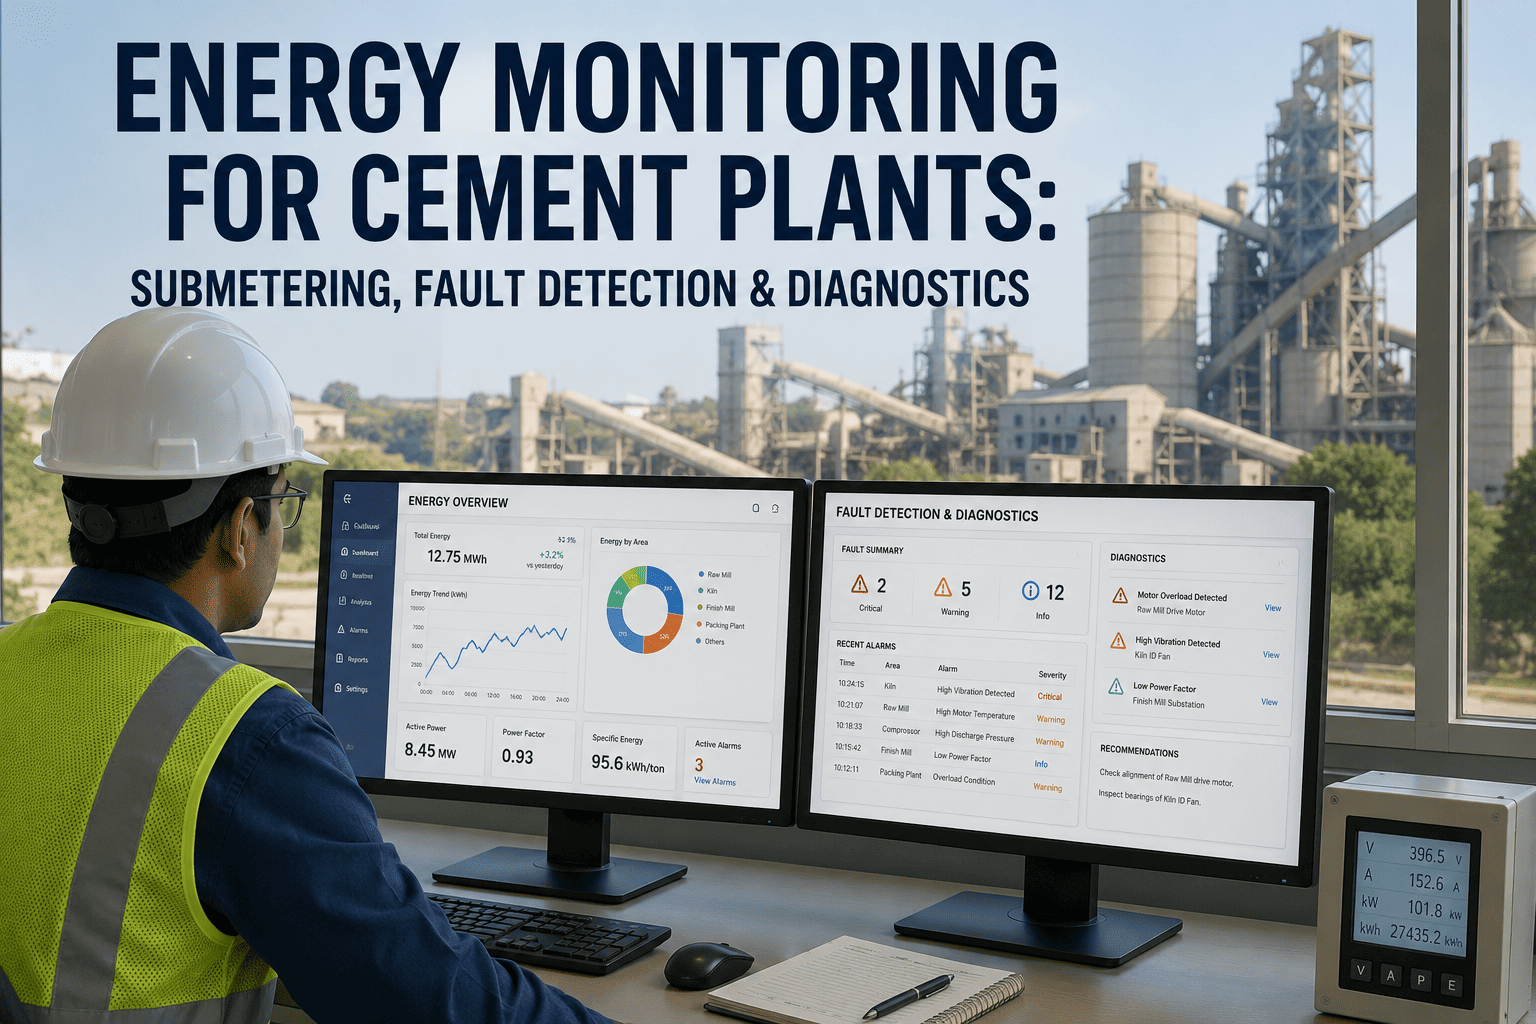
Most cement plants know their total energy bill down to the rupee, but very few know which mill, fan, or compressor is actually driving it up in a given week. A single meter at the main incomer tells you what you spent, not where it went. Sign up to see how Oxmaint turns submetered energy data into fault alerts tied to the equipment actually causing the draw.
60-70%
Typical share of a cement plant's operating cost tied to power and fuel
5-15%
Energy waste commonly hidden inside normal-looking equipment operation
3 Levels
Submetering granularity that separates plant-wide, section, and equipment-level visibility
Weeks
How long an inefficient motor or fan can run before a bill spike gets noticed
One Meter Can't Tell You Where the Waste Is
A plant-level energy bill is a lagging number. It confirms a problem existed last month, not which raw mill, kiln fan, or compressor caused it. Without submetering down to the equipment that actually consumes the power, every energy-saving conversation stays a guess dressed up as a strategy.
Submetering Granularity Across a Cement Plant
| Metering Level |
What It Shows |
Limitation |
| Plant-wide |
Total consumption and demand charges for the whole facility |
Cannot point to which section or shift drove a spike |
| Section-level |
Consumption by raw mill, kiln, cement mill, or packing area |
Still blends efficient and inefficient equipment in the same section |
| Equipment-level |
Load on a specific fan, compressor, motor, or drive |
Needs more meters and a system that ties readings back to that asset's history |
Turn Submeter Data Into Equipment-Level Answers
Oxmaint ties submeter readings to each asset's maintenance history, so a rising kWh trend on a specific fan or mill shows up as a flagged anomaly instead of getting lost in the plant-wide total. Sign up for a free trial to connect your first submeter, or book a demo to see the fault detection workflow.
What Fault Detection and Diagnostics Actually Catches
| Energy Signal |
Likely Root Cause |
| Gradual kWh creep on a fixed load |
Bearing wear, belt slip, or a motor drawing more current to do the same work |
| Power draw with no matching output change |
Equipment cycling or running when it should be idled or shut down |
| Power factor drifting lower |
Aging motors or under-sized capacitor banks losing correction capacity |
| Repeated demand spikes at the same time daily |
Overlapping equipment startups that could be staggered to cut peak charges |
Without FDD vs With FDD in Place
Without Fault Detection
Energy waste is only visible once the monthly bill lands
No way to tell whether a spike came from one asset or plant-wide load
Efficiency issues get fixed only after they cause a bigger failure
With Fault Detection
Anomalies surface within days of a load pattern shifting, not a month later
Each alert is tied to a specific asset with its own consumption baseline
Energy-driven maintenance gets scheduled before the fault worsens
Where a CMMS Turns Energy Data Into Action
Detecting an anomaly is only useful if it reaches the person who can fix it. Oxmaint takes submetered energy readings, compares them against each asset's baseline and service history, and converts confirmed deviations into work orders so the flagged fan, motor, or mill gets checked before the pattern repeats.
Frequently Asked Questions
Q
Where should a cement plant install its first submeters?
Start with the highest-load equipment, kiln drives, raw and cement mills, and main compressors, since these typically account for the largest share of the bill and offer the clearest return on visibility.
Q
Is fault detection and diagnostics the same as an energy dashboard?
No. A dashboard shows raw consumption trends for someone to interpret, while FDD compares live readings against each asset's expected baseline and actively flags the deviations that point to a fault.
Q
Can energy anomalies really predict a mechanical failure?
Often yes, since a motor or fan drawing more power for the same output is frequently the electrical signature of bearing wear, misalignment, or a belt problem building well before it shows up as noise or vibration.
See Which Asset Is Actually Driving the Bill
Oxmaint ties submeter data to each equipment's history and flags the deviations that point to a real fault, so energy waste turns into a scheduled work order instead of a line item nobody explains. Sign up for a free trial and connect your first submeter, or book a demo to see the fault alerts in action.