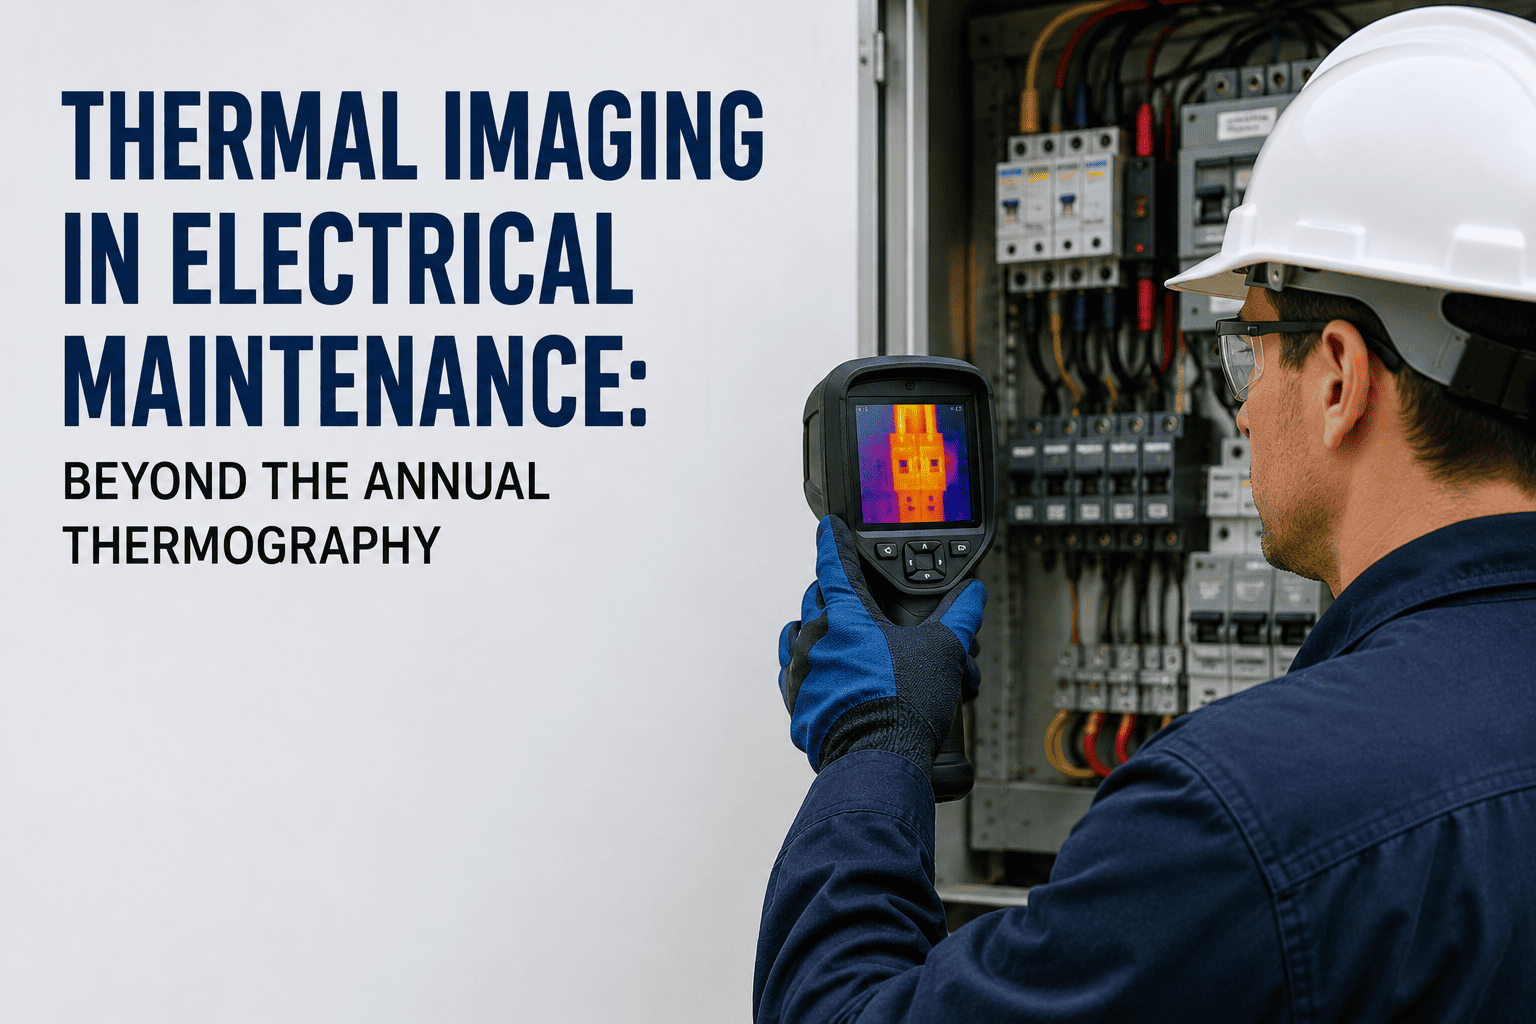
A loose lug or a degrading contact runs hot long before it ever trips a breaker. The problem is that a once-a-year thermography survey only catches that fault if it happens to exist on the one day someone points a camera at the panel. Everywhere else in the calendar, the connection can go from warm to catastrophic without anyone knowing. This is why UK electrical maintenance teams on critical switchgear are moving from scheduled thermal surveys to fixed cameras and continuous trend analysis — and why the shift changes what "thermal imaging maintenance" actually means. A CMMS like OxMaint ties that continuous data straight to a work order, so a rising delta-T becomes a scheduled repair instead of a line in a report nobody re-opens until next year.
Turn Rising Delta-T Into a Scheduled Repair
Fixed camera readings, ΔT threshold alerts, and trend dashboards linked straight into work orders — so a thermal anomaly gets fixed before it becomes an outage.
Why an Annual Survey Misses Most Failures
An annual thermography survey is a single snapshot on a single day, usually taken under whatever load the plant happens to be running at that hour. A connection that's fine at 40% load in June can be running dangerously hot at 90% load in December, and nobody will see it until the next scheduled visit — or until it fails. Fixed cameras and continuous monitoring close that gap by watching the same points around the clock, under real operating load, every day of the year.
| Factor | Annual Survey | Fixed / Continuous Monitoring |
|---|---|---|
| Detection window | One day per year | Every operating hour |
| Load condition captured | Whatever load exists that day | Full range, including peak load |
| Typical miss window | Up to 11 months | Hours to days |
| Best suited for | Non-critical, accessible equipment | Critical switchgear, single-train assets |
What a Continuous Thermal System Actually Catches
Loose Connections
The single most common electrical fault. Contact resistance rises, heat builds locally, and the hotspot appears only under real current draw.
Overloaded Circuits
Conductors and breakers running above rated capacity heat evenly along their length rather than at a single point — a different signature from a loose joint.
Unbalanced Phase Loads
One phase running noticeably hotter than the other two, even with all connections tight, points to load imbalance rather than a mechanical fault.
Insulation Degradation
Slow, steady temperature creep over weeks rather than a sudden spike often indicates aging insulation losing its ability to dissipate heat.
Reading the Delta-T: What the Temperature Rise Tells You
The absolute temperature of a connection matters less than how far it sits above a reference point — either ambient air or a comparable phase or component. This difference, the delta-T, is what field thermographers actually classify severity against.
Minor — Monitor
A small rise above reference. Log it, note the load condition at the time, and recheck at the next scheduled reading rather than acting immediately.
Serious — Schedule Repair
A clear deviation from normal. Plan a repair at the next available outage window; don't wait for the next annual survey to confirm it.
Critical — Act Now
This level indicates advanced deterioration. De-energise and repair as soon as it's safe to do so; the connection is close to failure.
From Thermal Alarm to Planned Repair
Baseline Set
A fixed camera establishes normal operating temperature for each monitored point across a full load cycle.
Trend Deviation
Readings begin drifting above baseline. Still within normal range, but the direction of travel is logged and watched.
Threshold Crossed
ΔT crosses the serious threshold. A work order is raised with the fault location and reading history attached.
Repair Confirmed
Connection is repaired and re-imaged under load to confirm the reading has returned to baseline before closing the order.
The Numbers Behind the Case for Continuous Monitoring
A survey tells you the temperature on the day someone was watching. Trending tells you whether that temperature is climbing, and how fast. Sign up free to see delta-T trending running against a per-point baseline instead of a once-a-year reading.
How OxMaint Connects Thermal Data to Repairs
Fixed Camera Integration
Readings from permanently mounted IR cameras on MV and LV switchgear feed straight into the asset record, point by point.
ΔT Threshold Alerts
Alerts trigger on delta-T against a per-asset baseline, not a generic fixed temperature, so seasonal load swings don't cause false alarms.
Trend Dashboards
Every monitored point shows its full temperature history, so a slow creep is visible weeks before it becomes a critical reading.
Auto Work Order on Breach
A threshold breach raises a work order automatically with the fault location, reading history, and priority already attached.
Stop Waiting a Year to Find Out What's Overheating
Fixed thermal cameras, per-asset ΔT baselines, and automatic work orders — built so a hotspot becomes a scheduled repair, not a surprise outage.
Frequently Asked Questions
Is annual thermography still worth doing if I have fixed cameras?
Yes, for points a fixed camera doesn't cover. Fixed cameras are typically installed on the highest-risk switchgear; a periodic survey still has value for the rest of the electrical system.
What's the difference between a hotspot from a loose connection and one from overload?
A loose connection heats a single, localised point at the joint itself. An overloaded circuit heats more evenly along the length of the conductor or breaker, reflecting excess current rather than a point of resistance.
How is delta-T measured in practice?
Delta-T compares the temperature of the suspect point against a reference — either ambient air temperature or a comparable component under the same load, such as the same point on another phase.
Do fixed thermal cameras need line-of-sight to every connection?
Yes. Cameras are positioned to view specific known risk points, such as bus bar joints or breaker connections, rather than the whole panel, so placement is planned around the highest-consequence components.
Why do false alarms happen with fixed threshold temperatures?
A single fixed temperature limit doesn't account for seasonal or load-driven swings that are normal for that asset. Comparing against a per-asset baseline and tracking delta-T over time reduces false positives significantly.