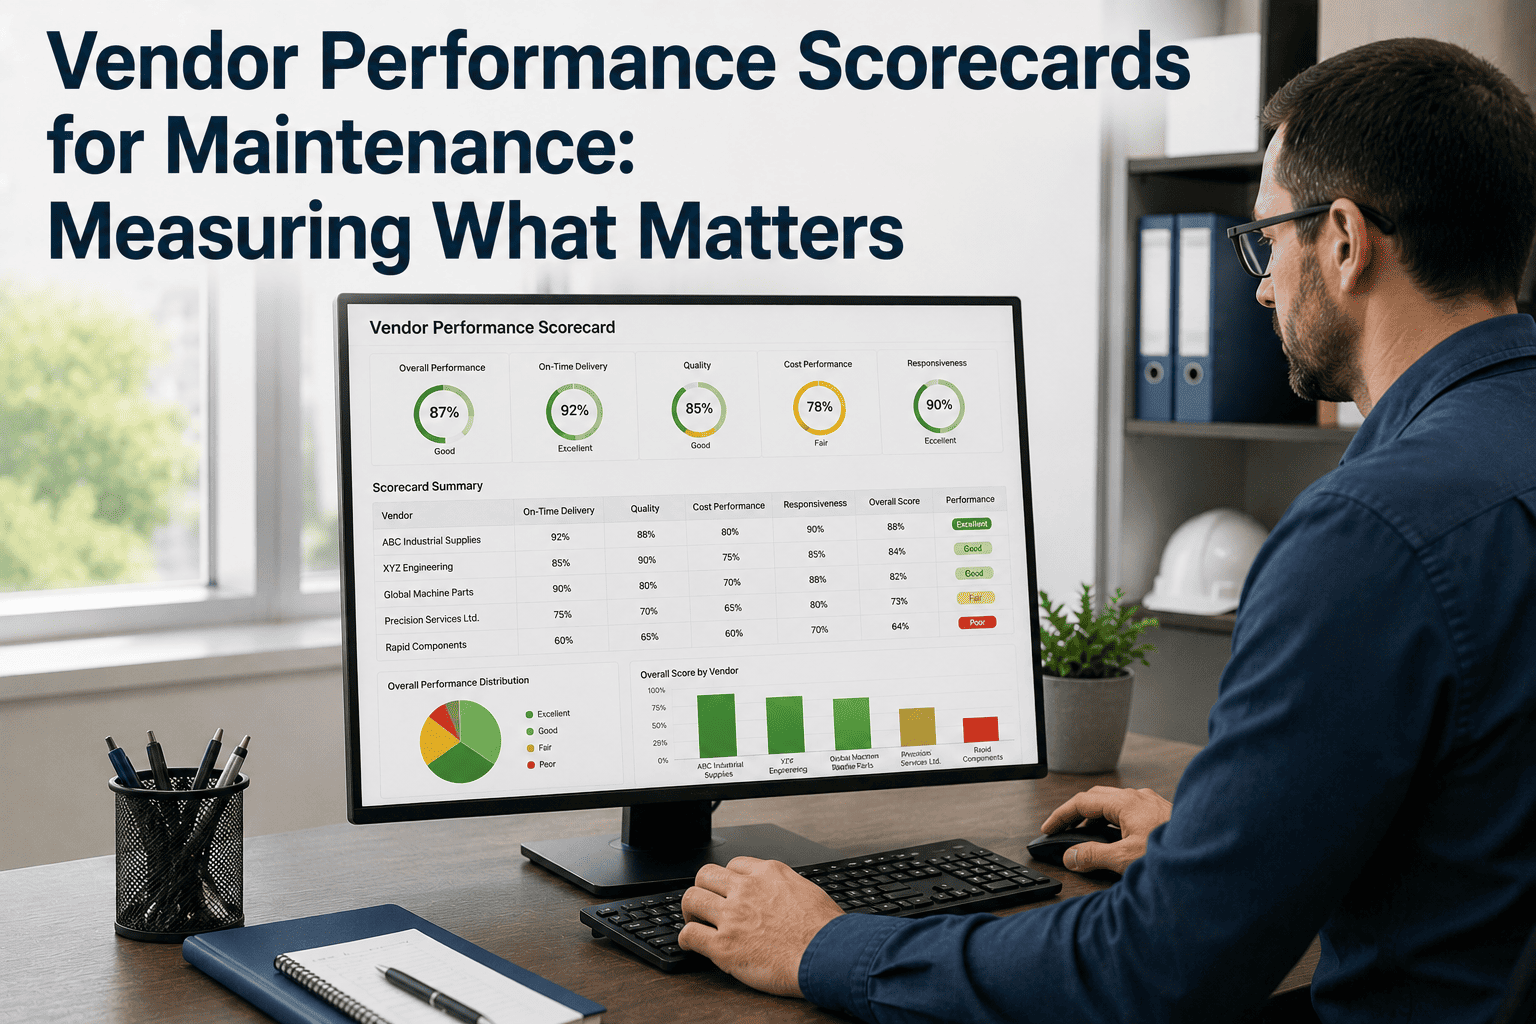
Most maintenance vendors get judged on the same thing every time: whether last week's delivery was late. That's one data point, and it's usually the wrong one to base a supplier relationship on. A vendor who ships on time but sends the wrong spec twice a quarter is a bigger risk than one who's occasionally a day late but never sends a defective part. A proper scorecard tracks the metrics that actually predict future performance — OTIF, defect rate, quote turnaround, and technical responsiveness — not just whether the last delivery hit the dock on schedule. A CMMS like OxMaint pulls these numbers from the same purchase orders and work orders your team already logs, so the scorecard builds itself instead of becoming a quarterly spreadsheet exercise.
Build Vendor Scorecards From Data You Already Have
Track OTIF, defect rate, quote turnaround, and responsiveness automatically from purchase orders and work orders already logged in your system.
The Four Metrics That Actually Predict Vendor Risk
A scorecard doesn't need twenty metrics to be useful. These four, tracked consistently, cover delivery, quality, speed, and support — the areas where a supplier relationship usually breaks down.
OTIF
On-time-in-full measures whether the right quantity arrived by the promised date, catching both late and short deliveries.
Defect Rate
The share of parts or work rejected on arrival or during use, which often flags a quality issue before it hits a delivery number.
Quote Turnaround
How long a vendor takes to return a quote, a strong early signal of how they'll respond once there's an urgent breakdown.
Technical Responsiveness
Time to answer a technical query or send a spec sheet, which matters more during a breakdown than any contract clause.
What Each Metric Actually Tells You
| Metric | What Good Looks Like | What It Predicts |
|---|---|---|
| OTIF | 95%+ of orders complete and on time | Whether planned maintenance will start on schedule |
| Defect rate | Under 2% of parts rejected or returned | Hidden rework cost that never shows up in the invoice |
| Quote turnaround | Under 48 hours for standard requests | How quickly the vendor will respond to an emergency call |
| Technical responsiveness | Same-day answer to a technical query | How much engineering support you'll get once the contract is signed |
Running the Quarterly Review
Pull the Numbers Automatically
Score each vendor from purchase order and work order data already logged, rather than a manual survey at quarter-end.
Rank by Trend, Not Just Score
A vendor trending downward from a good baseline needs attention sooner than one that's steady at an average score.
Hold the Business Review
Share the scorecard directly with the vendor and agree specific, measurable actions rather than a general improvement request.
Feed the Next Sourcing Decision
Renewal and re-tender decisions reference twelve months of scored performance, not just who was cheapest at the last bid.
Vendor Management Maturity
Gut Feel
Vendor reputation is based on whoever complained loudest last, with no consistent metric behind the opinion.
Scored but Not Shared
A scorecard exists internally, but vendors never see it, so there's no pressure or incentive for them to improve.
Scored, Shared, and Actioned
Vendors see their own scorecard every quarter, and it directly informs renewal, volume, and re-tender decisions.
Why Scorecards Get Abandoned After One Quarter
The usual reason a scorecard dies after its first attempt isn't lack of interest — it's that someone had to manually chase delivery dates, rejection logs, and email response times out of three different systems to build it. By the second quarter, nobody has the hours to do it again.
A scorecard only survives past the first quarter if it pulls from data the team is already generating. Sign up free to start building vendor scorecards from your existing purchase orders, or book a demo to see a live scorecard for one of your current suppliers.
Turn Vendor Reviews Into a Five-Minute Task
OTIF, defect rate, quote turnaround, and responsiveness tracked automatically, ready for every quarterly business review.
Frequently Asked Questions
How many vendors should get a formal scorecard?
Most procurement teams focus formal scorecards on strategic and critical-spend suppliers first, since that's where a performance dip has the biggest operational impact.
Should the vendor see their own scorecard?
Sharing the scorecard directly with the vendor is usually what drives improvement, since an internal-only score has no way to create accountability.
What counts as a good defect rate for MRO parts?
Many maintenance buyers treat a defect rate under 2% as acceptable, with anything higher triggering a closer look at the vendor's quality process.
How is quote turnaround different from delivery performance?
Quote turnaround measures pre-order responsiveness, which is a leading indicator of how a vendor will behave in an urgent situation, before any delivery commitment even exists.
Can a scorecard be built without new software?
It can, but most teams find it only survives long-term when the metrics pull automatically from existing purchase order and work order data rather than a manually updated spreadsheet.